Back to Final GUI Modifications
Process Attributes
The Blueprint Project Template created a complete project with basic accretion, container and circuit, that is sufficient for this application. As are the attributes for the Process, and Autonomous Process Role. Thus we can build and test the application as is.
Build and Test
We can now do a final compile, link and test.
Compile the FDTD project.
Compile and Link the GUI project.
Run the application.
Press Start on the GUI Dialog.
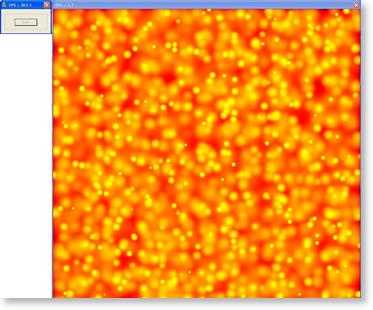
The Display should now update with droplet waves, and the two dialogs Title Bars will show the Processing and Display frame rates. (The images below show the Release build running on an 8-core processor).
The Windows Task Manager can be run to view the processor loading across the cores.

In this figure we can clearly see that the system, although evenly balanced, is not fully loaded. This loading can be improved (left as an exercise to the reader) by increasing the buffer depths and reentrancies (allowing parts of the system to run ahead). However, the real bottleneck in this system is the Pixellate and Draw functions. These functions (with dimension [1]) deal with the entire 1024x1024 Pixmap each time. This can be seen in Task Manager window as the red lines. These lines are the system kernel time or time that system calls are executing. These calls are clearly limited to a single core, and hence the bottleneck. Breaking the jobs that make system calls into smaller tasks allows these to be spread around the system.
The Pixellate/Draw part of the circuit, could be parallelized by increasing the dimensionalities to NB, and modifying their algorithms to handle each band separately. This is left as an exercise to the reader.
To exit the application press X on either dialog
Go back to Main Page

 Click to enlarge